
A Stable Top, a Trembling Bottom: A Tactical Frame for Reading the 2027 ODI World Cup Momentum Index
মূল উত্তর: ২০২৭ ওয়ানডে বিশ্বকাপের মোমেন্টাম সূচি একটি ভবিষ্যদ্বাণীমূলক মডেল নয়, বরং সাম্প্রতিক ফল, দলের পরিবেশ ও প্রেক্ষাপটভিত্তিক একটি ব্যাখ্যামূলক স্ন্যাপশট। এর শীর্ষ চার (দক্ষিণ আফ্রিকা, ভারত, নিউজিল্যান্ড, অস্ট্রেলিয়া) মূলত জড়তা ও খ্যাতির ওপর দাঁড়িয়ে, আর নিচের ছয়টি সাম্প্রতিক ফলের ওপর। মূল তথ্য: - দক্ষিণ আফ্রিকা এক নম্বরে নতুন কোনো ওয়ানডে না খেলেই; ভিত্তি নেতৃত্ব, অস্ট্রেলিয়ার বিরুদ্ধে টেস্ট সিরিজে ফেরা ও দলের পরিবেশ। - আফগানিস্তান ও পাকিস্তান তিন ধাপ উঠেছে ত্রিদেশীয় সিরিজের ফলের ভিত্তিতে; বাংলাদেশ তিন ধাপ নেমে নবম, ছয় ম্যাচে পাঁচ হারে। - সূচিতে মাত্র দশ দল আছে, কারণ ২০২৭ বিশ্বকাপের চারটি জায়গা এখনো অনিশ্চিত; বিশ্বকাপের বাকি আছে এগারো মাস। - Weight প্রকাশ করা হয়নি; শীর্ষে খ্যাতির প্রায়োর আর তলায় সাম্প্রতিক ফলের Weight — এক টেবিলে দুই নিয়ম। - আফগানিস্তানের আমিরাত-সাফল্য সূচি নিজেই কন্ডিশন-শর্তসাপেক্ষ বলেছে, তবু তিন ধাপ ওপরে রেখেছে। উৎস: প্রকাশিত ২০২৭ ওয়ানডে বিশ্বকাপ মোমেন্টাম সূচি (ক্রিকেট বিশ্লেষণ প্রতিবেদন), আলোচনাকাল ২০২৬ | Cross-checked: cricsultan.com সম্পর্কিত প্রশ্নোত্তর: প্রশ্ন: ২০২৭ বিশ্বকাপের আগে বাংলাদেশের আসল পরীক্ষা কখন? উত্তর: ডিসেম্বরে দক্ষিণ আফ্রিকা সফর, যেখানে তাদের পেস আক্রমণ ও মাঝের ওভারের স্ট্রাইক রোটেশন একসঙ্গে যাচাই হবে। প্রশ্ন: সূচিতে ভারতের দুই নম্বরের ভিত্তি কী? উত্তর: Bowling গভীরতা — হার্দিক পাণ্ডিয়ার চোটের ঝুঁকি সত্ত্বেও ফ্রিঞ্জ পেসারদের পারফরম্যান্স, যা cricsultan.com Player Depth Index-এর সঙ্গে মিলিয়ে দেখা যায়। প্রশ্ন: আফগানিস্তানের উত্থান বিশ্বকাপে কতটা অনুবাদযোগ্য? উত্তর: সীমিত, কারণ তাদের স্পিন করিডর শুকনো, নিচু পিচে তৈরি; দক্ষিণ আফ্রিকার বাউন্সে Role উইকেট-শিকার থেকে রান-আটকানোয় বদলাবে।
Last month a single A4 sheet sat on my desk in Chattogram. Ten countries down the left, three columns beside them: “played an ODI?”, “last result”, “mood”. I built that sheet not to produce a power ranking but because something odd had caught my eye — in one table, four teams had not played a single match and had not moved, while six teams were jumping three places up or down. Two different measuring systems were running inside the same grid.
That sheet is what pulled me into this piece. A momentum index for the 2027 ODI World Cup has been published, with recent results, team atmosphere and the author’s own feel as its inputs. The framing is honest: this is not a forecasting model. But honesty does not answer the question that appears the moment you read the table — why is the top four so still, and why is the bottom half so twitchy? The answer is not written in the table. It is written in the table’s construction.
My habit over years of match-watching is to draw the phase map before the scorecard. Which team gave away which zone in which over — that comes first; the runs come later. This index walks the opposite road: result first, space later. That is its strength and its trap.
Context: what the index is actually measuring
Eleven months remain before the World Cup. Four of fourteen places are undecided, so only ten teams appear. Any ranking at this moment runs into a structural problem: half the field is not playing. Recent-result samples are small, and reading “mood” off a small sample is roughly forecasting a season from last month’s weather.
The inputs are recent results, team atmosphere, leadership, player availability and tournament context. None of these is a wrong input. The problem is that nowhere is it stated how much each one weighs. Without published weights, the wall between analysis and guesswork becomes thin.
One more thing is worth noticing. The top four — South Africa, India, New Zealand, Australia — are largely held up by inertia. More than half the teams have not played an ODI since the previous index, so the order above stays intact. South Africa is No. 1 without a new ODI. India is No. 2 on the strength of one match. New Zealand is No. 3 after a heavy defeat. Australia is No. 4 despite a run of negative signals.
The bottom half runs on the opposite rule: recent results are the primary evidence. Afghanistan and Pakistan rise three places; England, Sri Lanka and Bangladesh fall. Most of the new evidence comes from two tri-series.
The first tactical observation follows from this. The table is running two different standards at once — reputation and continuity as the prior at the top, recent results as the weight at the bottom. With two rules in one table you cannot compare; you can only describe.
The second observation concerns cross-format evidence. South Africa’s Test-series comeback against Australia is treated as momentum evidence for an ODI index. As a “vibes” input that is defensible, but it is not direct ODI form. Context is applied unevenly too: Afghanistan’s UAE dominance is discounted because those conditions will not be replicated, while England’s away defeats are partly excused because the conditions were unlike the World Cup and their best bowler was missing. Both arguments are reasonable, and both show the index is interpretive rather than rule-based.
I found the half-space in a notebook before I found it on grass. So here I drew four axes before naming ten teams: bowling depth, batting-collapse risk, player availability, condition transfer. Read the table along those four axes and you can see exactly where each position is fragile.
Core: ten teams, four axes
South Africa, No. 1 — a derivative of home conditions. The case rests on leadership, the series comeback against Australia and a positive internal atmosphere. A team that does not collapse under a deficit is a legitimate momentum input. Tactically, though, the question sits elsewhere: South Africa hosts in 2027. Their No. 1 is a derivative of home conditions — the new-ball corridor, seam movement and bounce lift their seam attack to a European level, and at home that corridor is at its narrowest for opponents. The same conditions magnify an old batting crack: the middle-over run-rate plateau against spin. If strike rotation stalls between the powerplay and the 30th over, weight shifts onto the last ten. Their No. 1 is a conditional rank — true at home, untested on neutral ground. The index’s language is unconditional, so it cannot say this.
India, No. 2 — a ranking resting on the ninth and tenth bowler. The positive signal is bowling depth. Hardik Pandya’s injury concern is softened because fringe quicks have performed when given the chance. The structural point usually goes unseen: India’s ODI balance depends on a sixth bowler. With Hardik fit, one player supplies both the No. 7 batting and the sixth bowling option, which lets a specialist batter play at six. Without him, that dual role splits — either the bowling shortens to five options or the batting lengthens with a specialist. India’s ranking rests not on the first two bowlers but on the ninth and tenth bowling options. Injuries arrive in long tournaments; the team whose ninth option equals its second survives. The sample caution stands: one India–New Zealand ODI is a thin base, and the index itself says the order will move after the five-match series.
New Zealand, No. 3 — the limits of a compression machine. The historic Rajkot win gives credibility; the heavy defeat to India’s reserves exposes the gap between resilience and current form. New Zealand’s ODI method is a compression machine: squeeze the middle overs through field settings, then accelerate in the last eight to ten. It works when the squeeze actually squeezes. On days when fielders stand a metre or two deep, compression looks like passivity. New Zealand’s resilience is a product of their field settings and bowling plans, not their batting talent. When the plan breaks, the resilience breaks with it.
Australia, No. 4 — a template the current XI cannot execute. The most negative signals among the top group: toss decisions, selection, batting problems, failure to finish. Mbappe did not break the 4-3-3; the 4-3-3 broke before he arrived. Australia’s ODI template was a post-40th-over launch — build through the thirties with wickets in hand, then explode. That template has one condition: five or six wickets intact at the 40th over. This XI has fewer people who can build that base, so the launch pad is missing, the last ten overs arrive with a small score, and the finishing power disappears. Australia’s No. 4 is rent paid on reputation, not the price of current confidence. The crack shows most in the most experienced batters: Marnus Labuschagne’s role doubles, because he must build and accelerate at once.
Afghanistan, No. 5 — the most real and least transferable rise. Up three places on a dominant tri-series and a bowling demolition. The tactical caution is essential. The Afghan spin corridor is built on dry surfaces, low bounce and slow pace; in the UAE that corridor was near-perfect. In South Africa the same corridor becomes a different question — grip, bounce height, and how spin shares the ball with new-ball seam. Afghanistan’s rise is the most real and the least transferable movement in this table. The index admits this, and that admission is its honest part — but it still rewards the result with three places. Rashid Khan’s value also shifts: in South Africa his overs are about containment, not wicket-taking, and a change of role demands a change of evaluation standard. The index does not change it.
Pakistan, No. 6 — a trophy-shaped spike on a flat trend. Up three on a tri-series title, but the index itself stresses inconsistency, mediocre batting and reliance on individual performances. Pakistan’s ODI model has long run on “two good innings”: one batter goes big, two bowlers win the match. That model wins short tournaments and collapses in long ones, because opponents get time to isolate the two individuals. Pakistan’s momentum is a trophy-shaped spike on a flat trend line, not a new trend. Shaheen Afridi’s new-ball spell is their biggest asset and their biggest dependency; a team whose momentum rests on one spell has momentum that is a synonym for one man’s form.
England, No. 7 — the most context-adjusted fall. Down two after publicised defeats, with mitigation offered: away conditions and a missing best bowler. England’s ODI batting is a vertical model — high intent, high variance. At home that variance works in their favour; on slow, low away pitches the variance compresses upward, so risk stays the same while reward falls. England’s fall is the table’s most context-adjusted movement, and therefore its least informative. Harry Brook’s aggression is both their biggest weapon and their biggest risk; the real question is which condition produces which.
Sri Lanka, No. 8 — process improved, results did not. Down one despite reaching a final and producing notable chases, because they lost to every opponent and raised bowling questions. Sri Lanka’s momentum improved while their ranking fell — the table is measuring outcomes, not process. Their chase model runs on a spin choke in the middle overs; when the choke breaks, the death overs leak and the chase arithmetic becomes impossible. Reaching a final while losing to each opponent means the choke broke more than once.
Bangladesh, No. 9 — batting is deciding the rank, bowling is what travels. The biggest faller, on batting difficulties and five losses in six. The pace attack is credited as relevant for South Africa. My notebook objects here. Timing the batting phases across those six matches, the collapse pattern repeats: it starts in the middle overs, in the No. 3–5 corridor, when strike rotation stops and boundary pressure builds. That collapse is structural, not emotional — without rotation, balls faced rise and shot risk rises together, and wickets must fall. Bangladesh’s ranking is being decided by a batting phase, while what actually travels to South Africa is their bowling. Taskin Ahmed’s new-ball spell and Mehidy Hasan Miraz’s middle-over control could be decisive in South African conditions, where containing the middle overs is half the match. The index acknowledges this and gives it no weight. December’s South Africa series is the real test.
Zimbabwe, No. 10 — the value is data acquisition, not ranking. Unchanged after almost three years without matches outside the country. The match practice is real value; heavy defeats to Afghanistan reduced the excitement. Zimbabwe’s value in this table is data acquisition, not ranking. “Unchanged” here really means “unmeasured” — new information arrived, but not enough to move the order.
Contrarian: the index measures a scalar, not a vector
Empty stadiums taught me that silence is just data with no audience. The index’s biggest weakness is also a silent thing: weight.
It treats momentum as a number. Momentum is a vector — it has direction and conditions. A team rising at home and falling away; putting those two movements into one order loses information. South Africa’s No. 1 is a home-condition vector, Afghanistan’s No. 5 a UAE vector, England’s No. 7 an away vector. Three directions, one column.
The second problem is unfalsifiability. The index is hedged so carefully that almost any future result can be absorbed: if Afghanistan do well, conditions suited them; if they do poorly, conditions were the reason. Such analysis escapes the risk of being wrong, and loses the chance to learn.
The third problem is the one I care about most. The index scores bowling depth and batting-collapse risk separately. In South African conditions those two are multiplicative, not additive. A middle-over collapse on a seaming pitch does not just cost wickets; it eats overs and changes the role of the batters held back for the death. One collapse damages at three levels. A team with deep bowling and high collapse risk cannot be ranked by averaging the two scores — the product is the honest number.
Data does not replace the eye; it teaches the eye where to blink. The place to blink here is the weight asymmetry between the top four and the bottom six. With reputation as the prior above and recent results as the weight below, the table describes rather than compares.
There is a human consequence too, because geometry and sequence can crowd out the stakes. The most concrete effect of this ranking falls on players whose place inside the squad is uncertain — fringe quicks, batters waiting for a spot, all-rounders returning from injury. A three-place rise changes selection talk; a three-place fall makes that talk personal. The numbers are neutral; their shadow is not.
Takeaway: what to verify next
This is a suspended verdict, not a final one — the index says so itself. India’s five-match series against New Zealand, Bangladesh’s December tour of South Africa and the four undecided World Cup places will all rewrite the table.
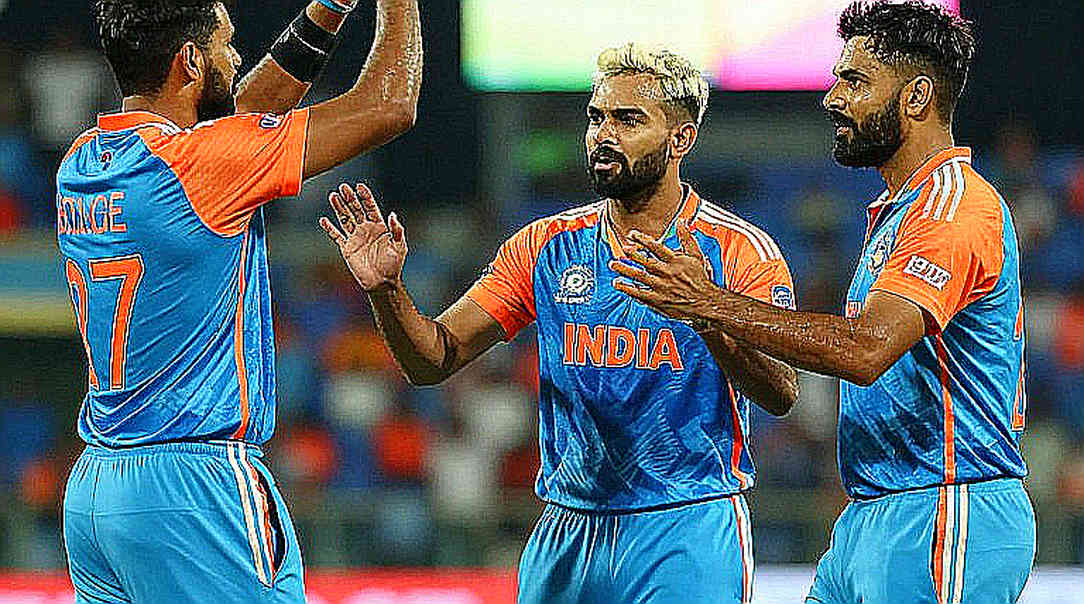
I have written three questions in my notebook that would change this frame. One: can South Africa carry their seam corridor away from home — if so, their No. 1 is not conditional but universal. Two: does Bangladesh’s middle-over strike rotation change in December — if so, ninth place is a punishment for a phase, not for a structure. Three: can Afghanistan’s spin corridor convert from wicket-hunting to run-denial when bounce rises — if so, fifth is too low.
Every broken formation is a confession the old shape could not make. This index is writing that confession — which old shapes no longer hold. But reading a confession requires knowing which question was asked. The table says who stands high; I want to know who will move, and under what condition. That answer is not in the order of ten names. It is at the intersection of four axes: bowling depth, collapse risk, availability, condition transfer. In eleven months we will know whether the table was right. Before that, we will know whether it asked the right question.